Introducing Pydantic Logfire
From the team behind Pydantic, Logfire is an observability platform built on the same belief as our open source library — that the most powerful tools can be easy to use.
What sets Logfire apart
-
 Simplicity and Power
Logfire's dashboard is simple relative to the power it provides, ensuring your entire engineering team will actually use it. Time-to-first-log should be less than 5 minutes.
-
 Python-centric Insights
From rich display of Python objects, to event-loop telemetry, to profiling Python code & database queries, Logfire gives you unparalleled visibility into your Python application's behavior.
-
Pydantic Integration
Understand the data flowing through your Pydantic models and get built-in analytics on validations.
Pydantic Logfire helps you instrument your applications with less code, less time, and better understanding.
-
 OpenTelemetry
Logfire is an opinionated wrapper around OpenTelemetry, allowing you to leverage existing tooling, infrastructure, and instrumentation for many common Python packages, and enabling support for virtually any language.
-
Structured Data
Include your Python objects in Logfire calls (lists, dict, dataclasses, Pydantic models, DataFrames, and more), and it'll end up as structured data in our platform ready to be queried.
-
 SQL
SQL
Query your data using standard SQL — all the control and (for many) nothing new to learn. Using SQL also means you can query your data with existing BI tools and database querying libraries.
Find the needle in a stack trace
We understand Python and its peculiarities. Pydantic Logfire was crafted by Python developers, for Python developers, addressing the unique challenges and opportunities of the Python environment. It's not just about having data; it's about having the right data, presented in ways that make sense for Python applications.
Simplicity and Power 
Emulating the Pydantic library's philosophy, Pydantic Logfire offers an intuitive start for beginners while providing the depth experts desire. It's the same balance of ease, sophistication, and productivity, reimagined for observability.
Within a few minutes you'll have your first logs:
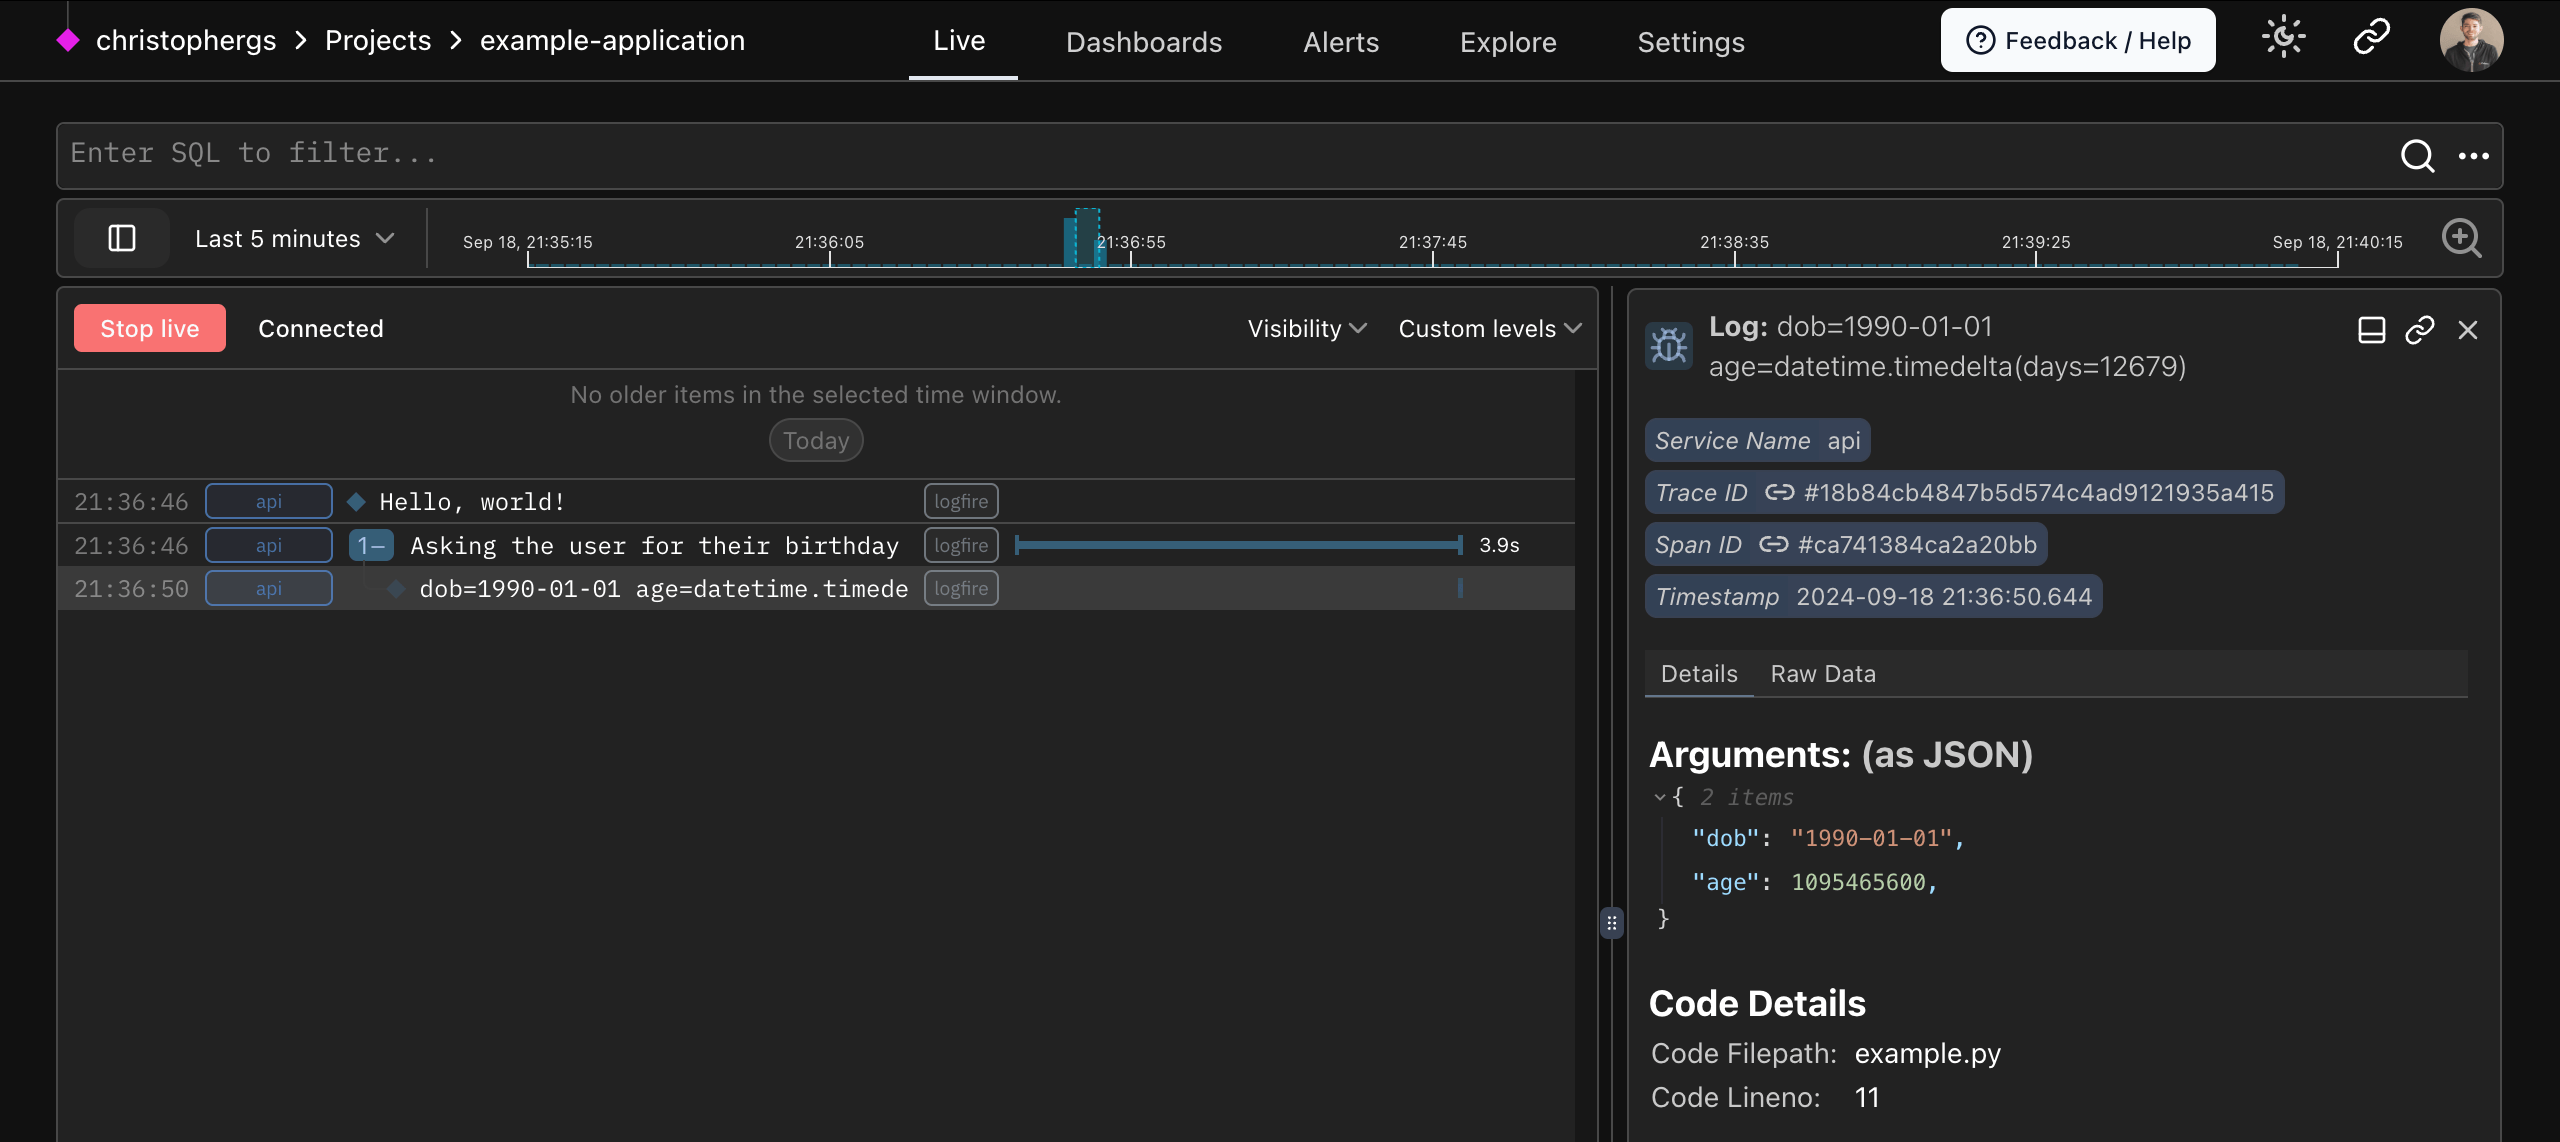
This might look similar to simple logging, but it's much more powerful — you get:
- Structured data from your logs
- Nested logs & traces to contextualize what you're viewing
- Custom-built platform to view your data, with no configuration required
- Pretty display of Python objects
Ready to try Logfire? Get Started! 🚀
Python-centric insights 
Pydantic Logfire automatically instruments your code for minimal manual effort, provides exceptional insights into async code, offers detailed performance analytics, and displays Python objects the same as the interpreter. Pydantic Logfire gives you a clearer view into how your Python is running than any other observability tool.
Rich display of Python objects
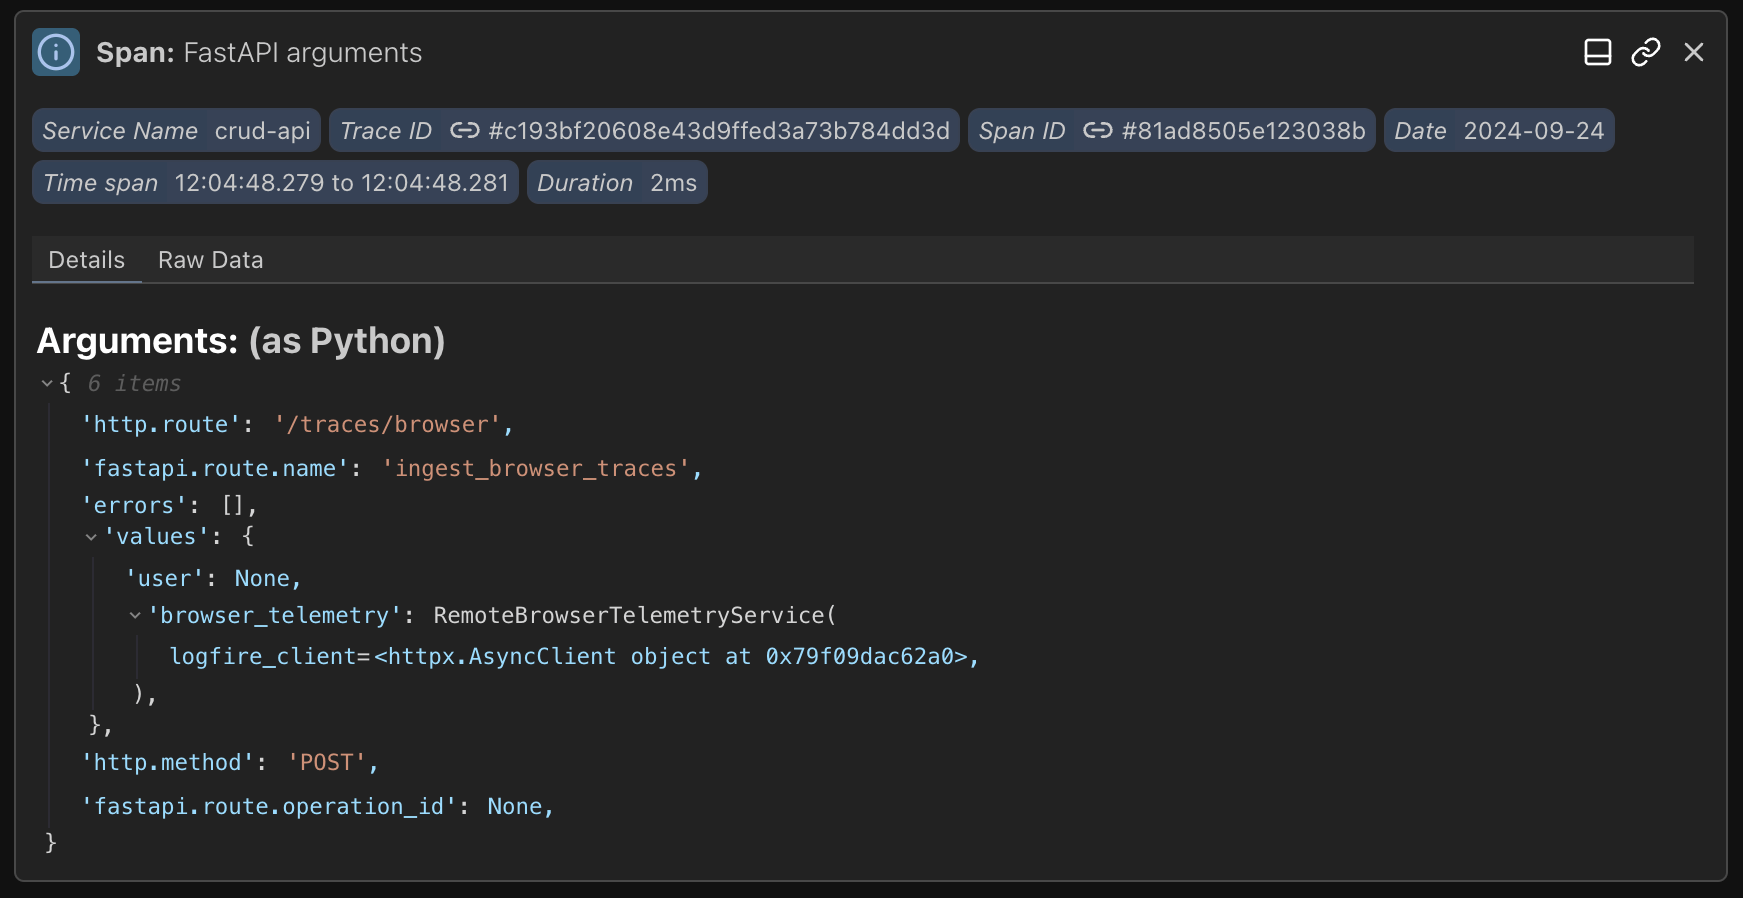
In this example, you can see the parameters passed to a FastAPI endpoint formatted as a Python object.
Profiling Python code
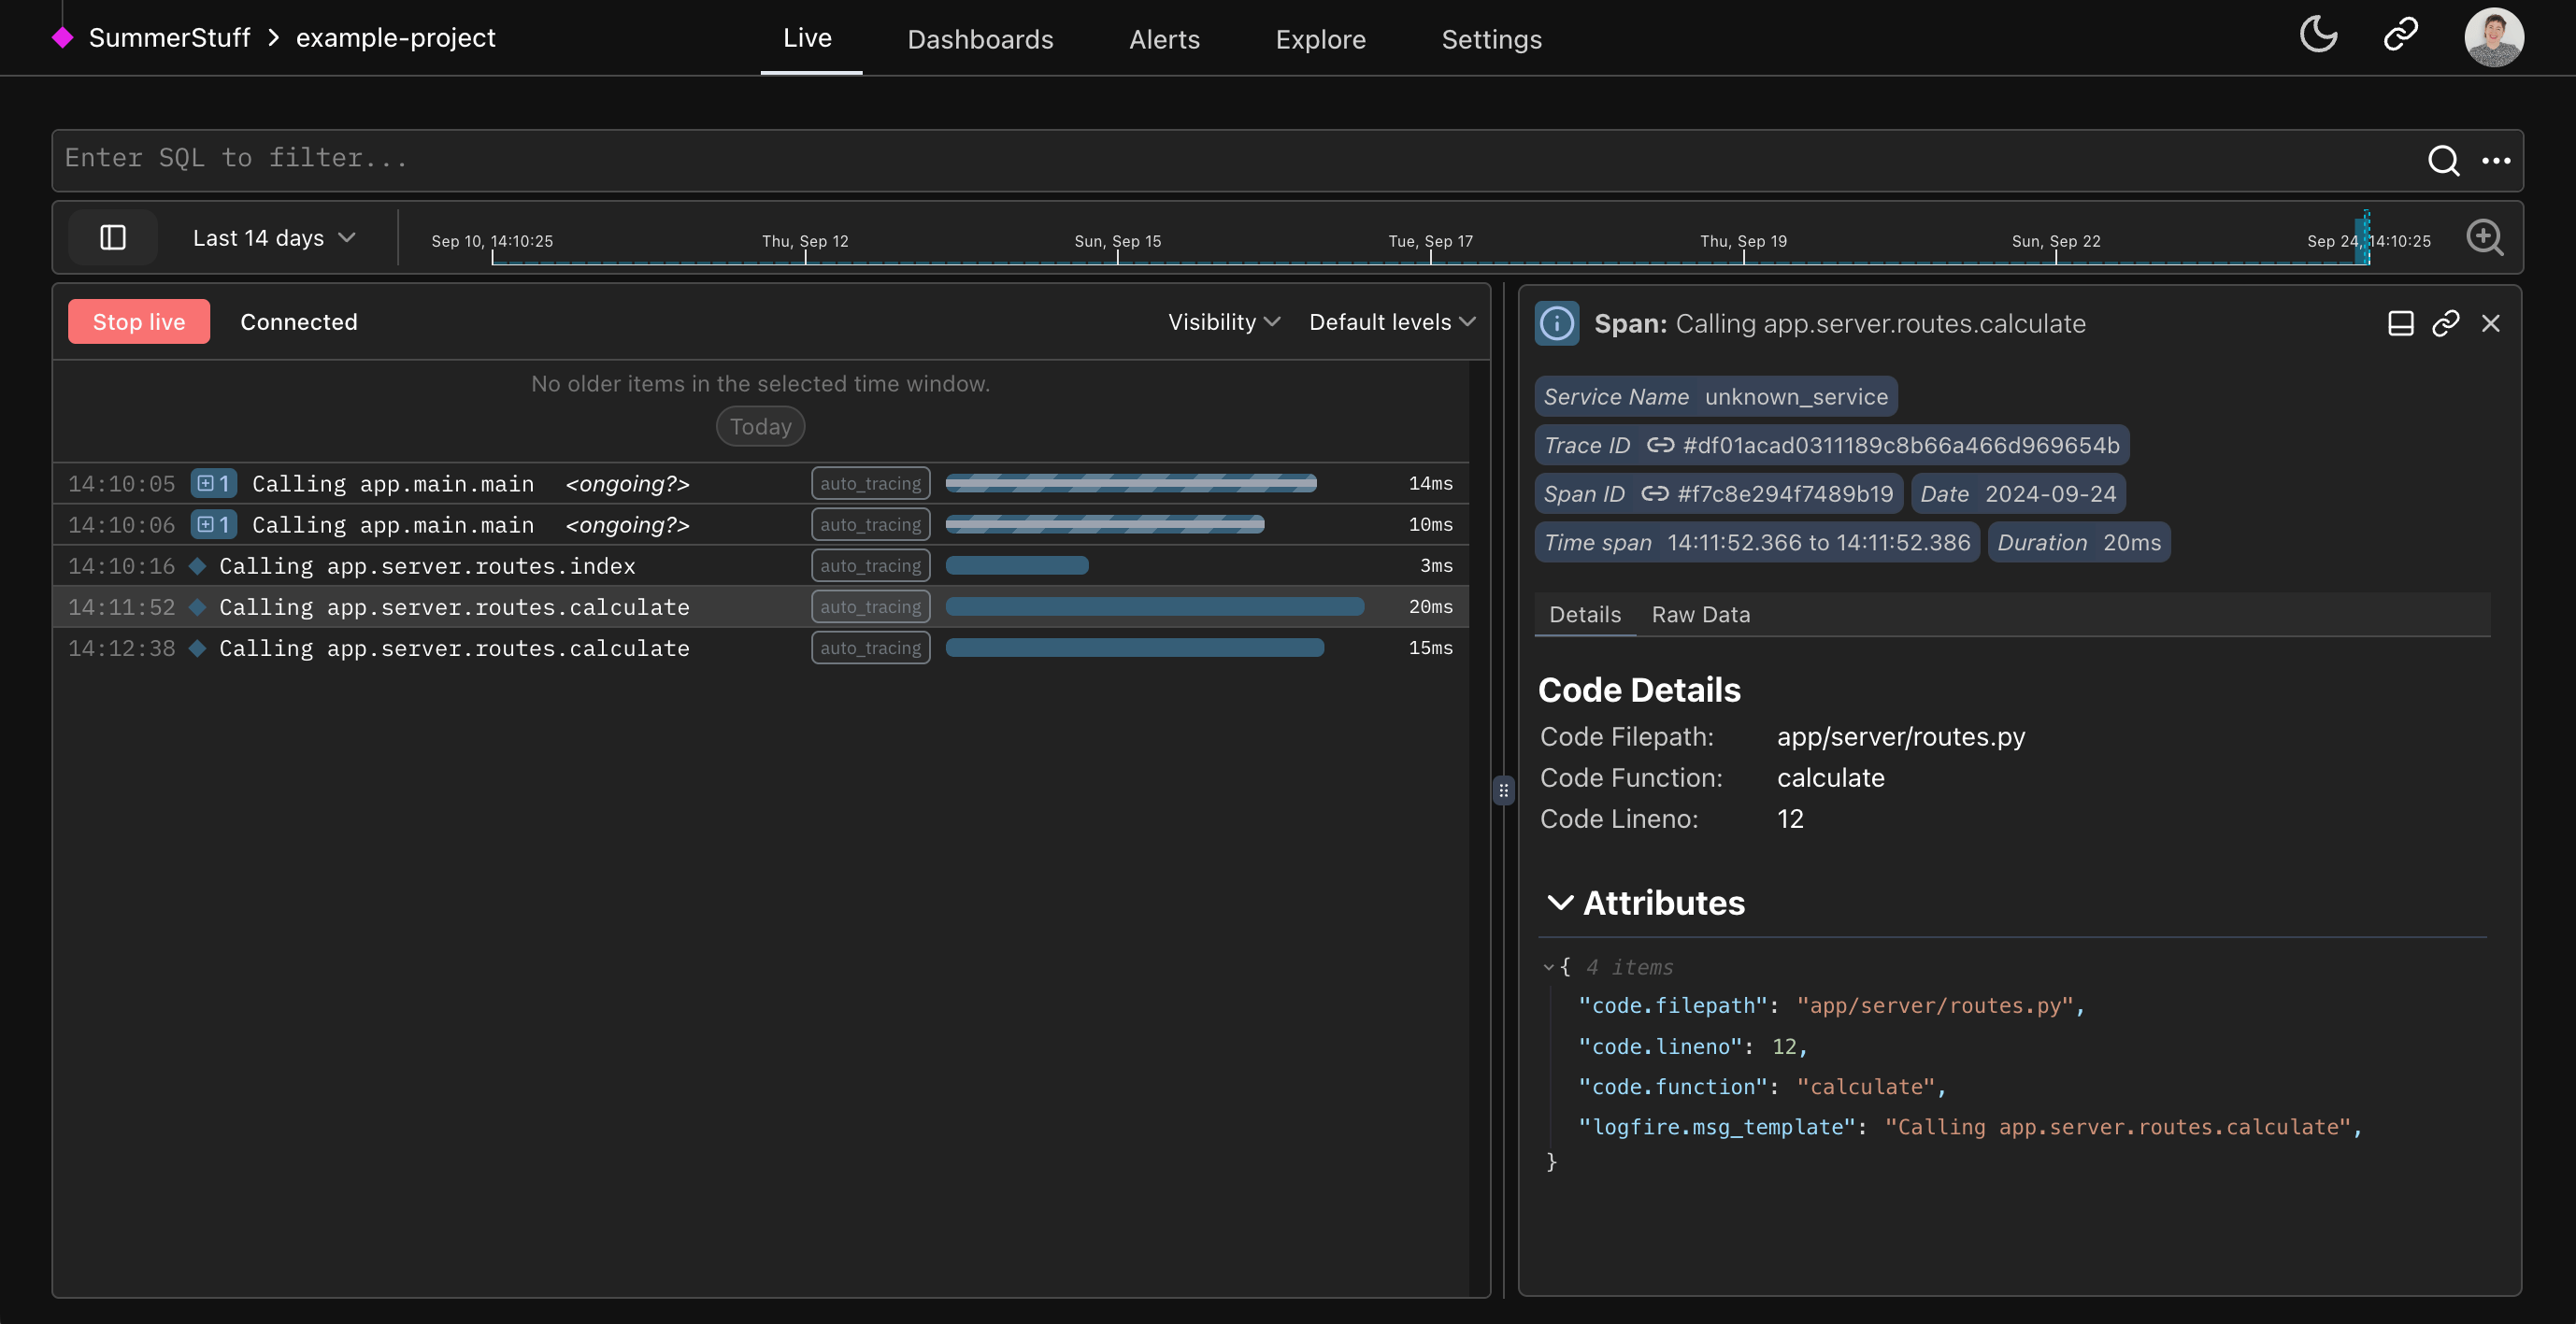
In this simple app example, you can see every interaction the user makes with the web app automatically traced to the Live view using the Auto-tracing method.
Pydantic integration
Logfire has an out-of-the-box Pydantic integration that lets you understand the data passing through your Pydantic models and get analytics on validations. For existing Pydantic users, it delivers unparalleled insights into your usage of Pydantic models.
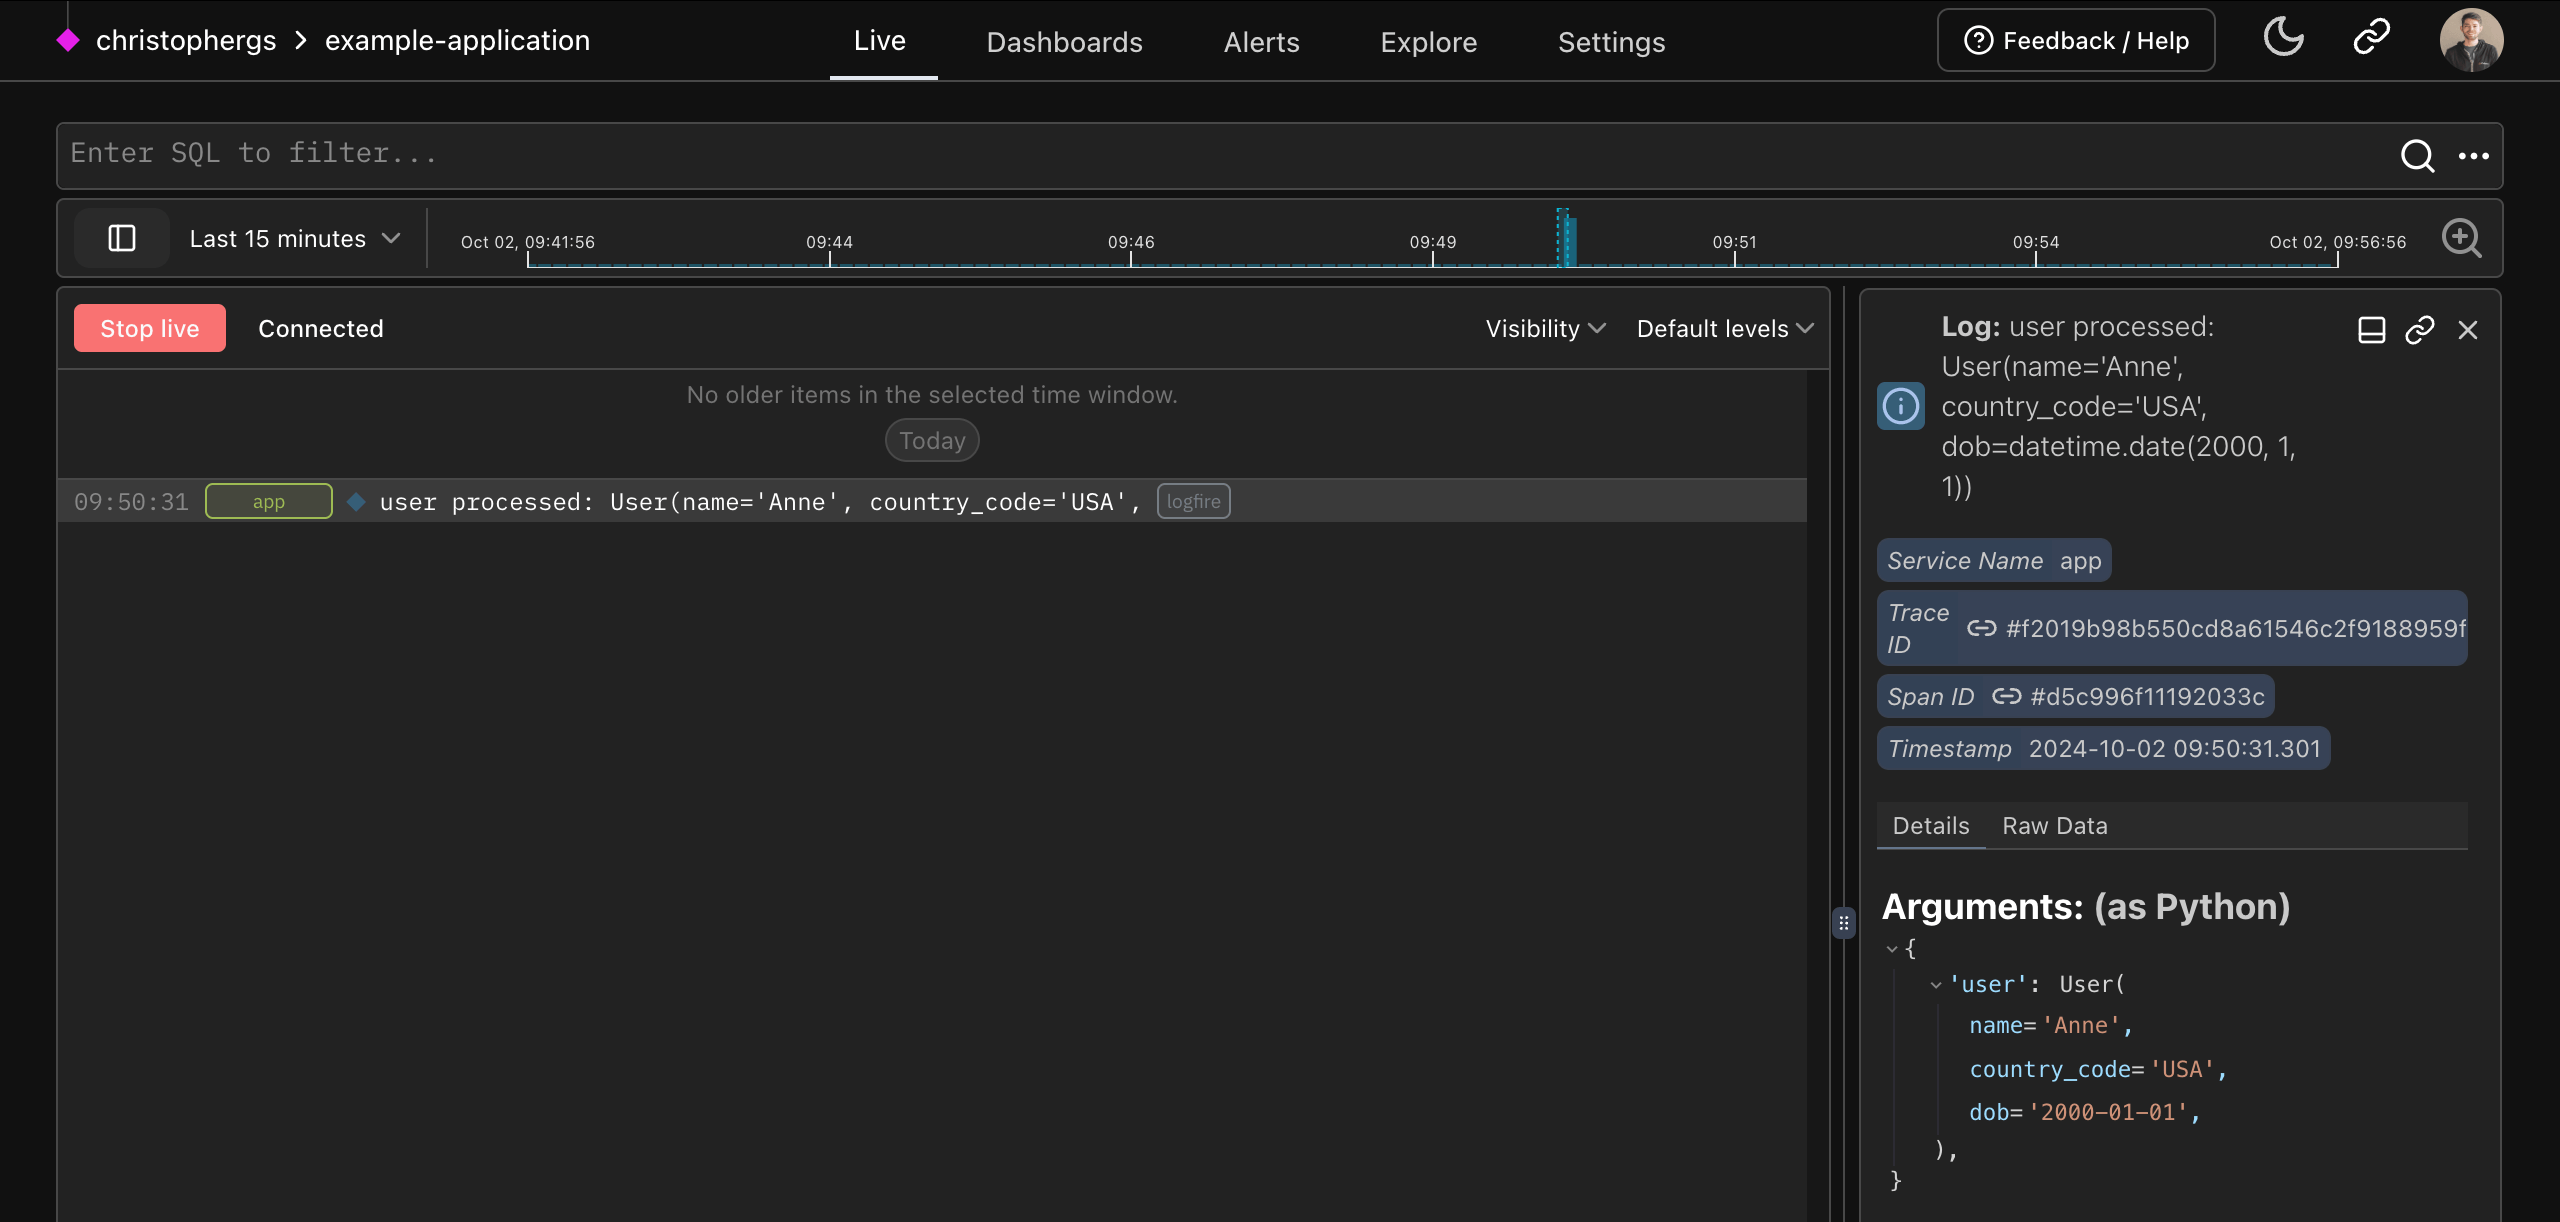
We can record Pydantic models directly:
from datetime import date

import logfire
from pydantic import BaseModel

logfire.configure()

class User(BaseModel):
    name: str
    country_code: str
    dob: date

user = User(name='Anne', country_code='USA', dob='2000-01-01')
logfire.info('user processed: {user!r}', user=user)  # (1)!
- This will show
user processed: User(name='Anne', country_code='US', dob=datetime.date(2000, 1, 1)), but also allow you to see a "pretty" view of the model within the Logfire Platform.
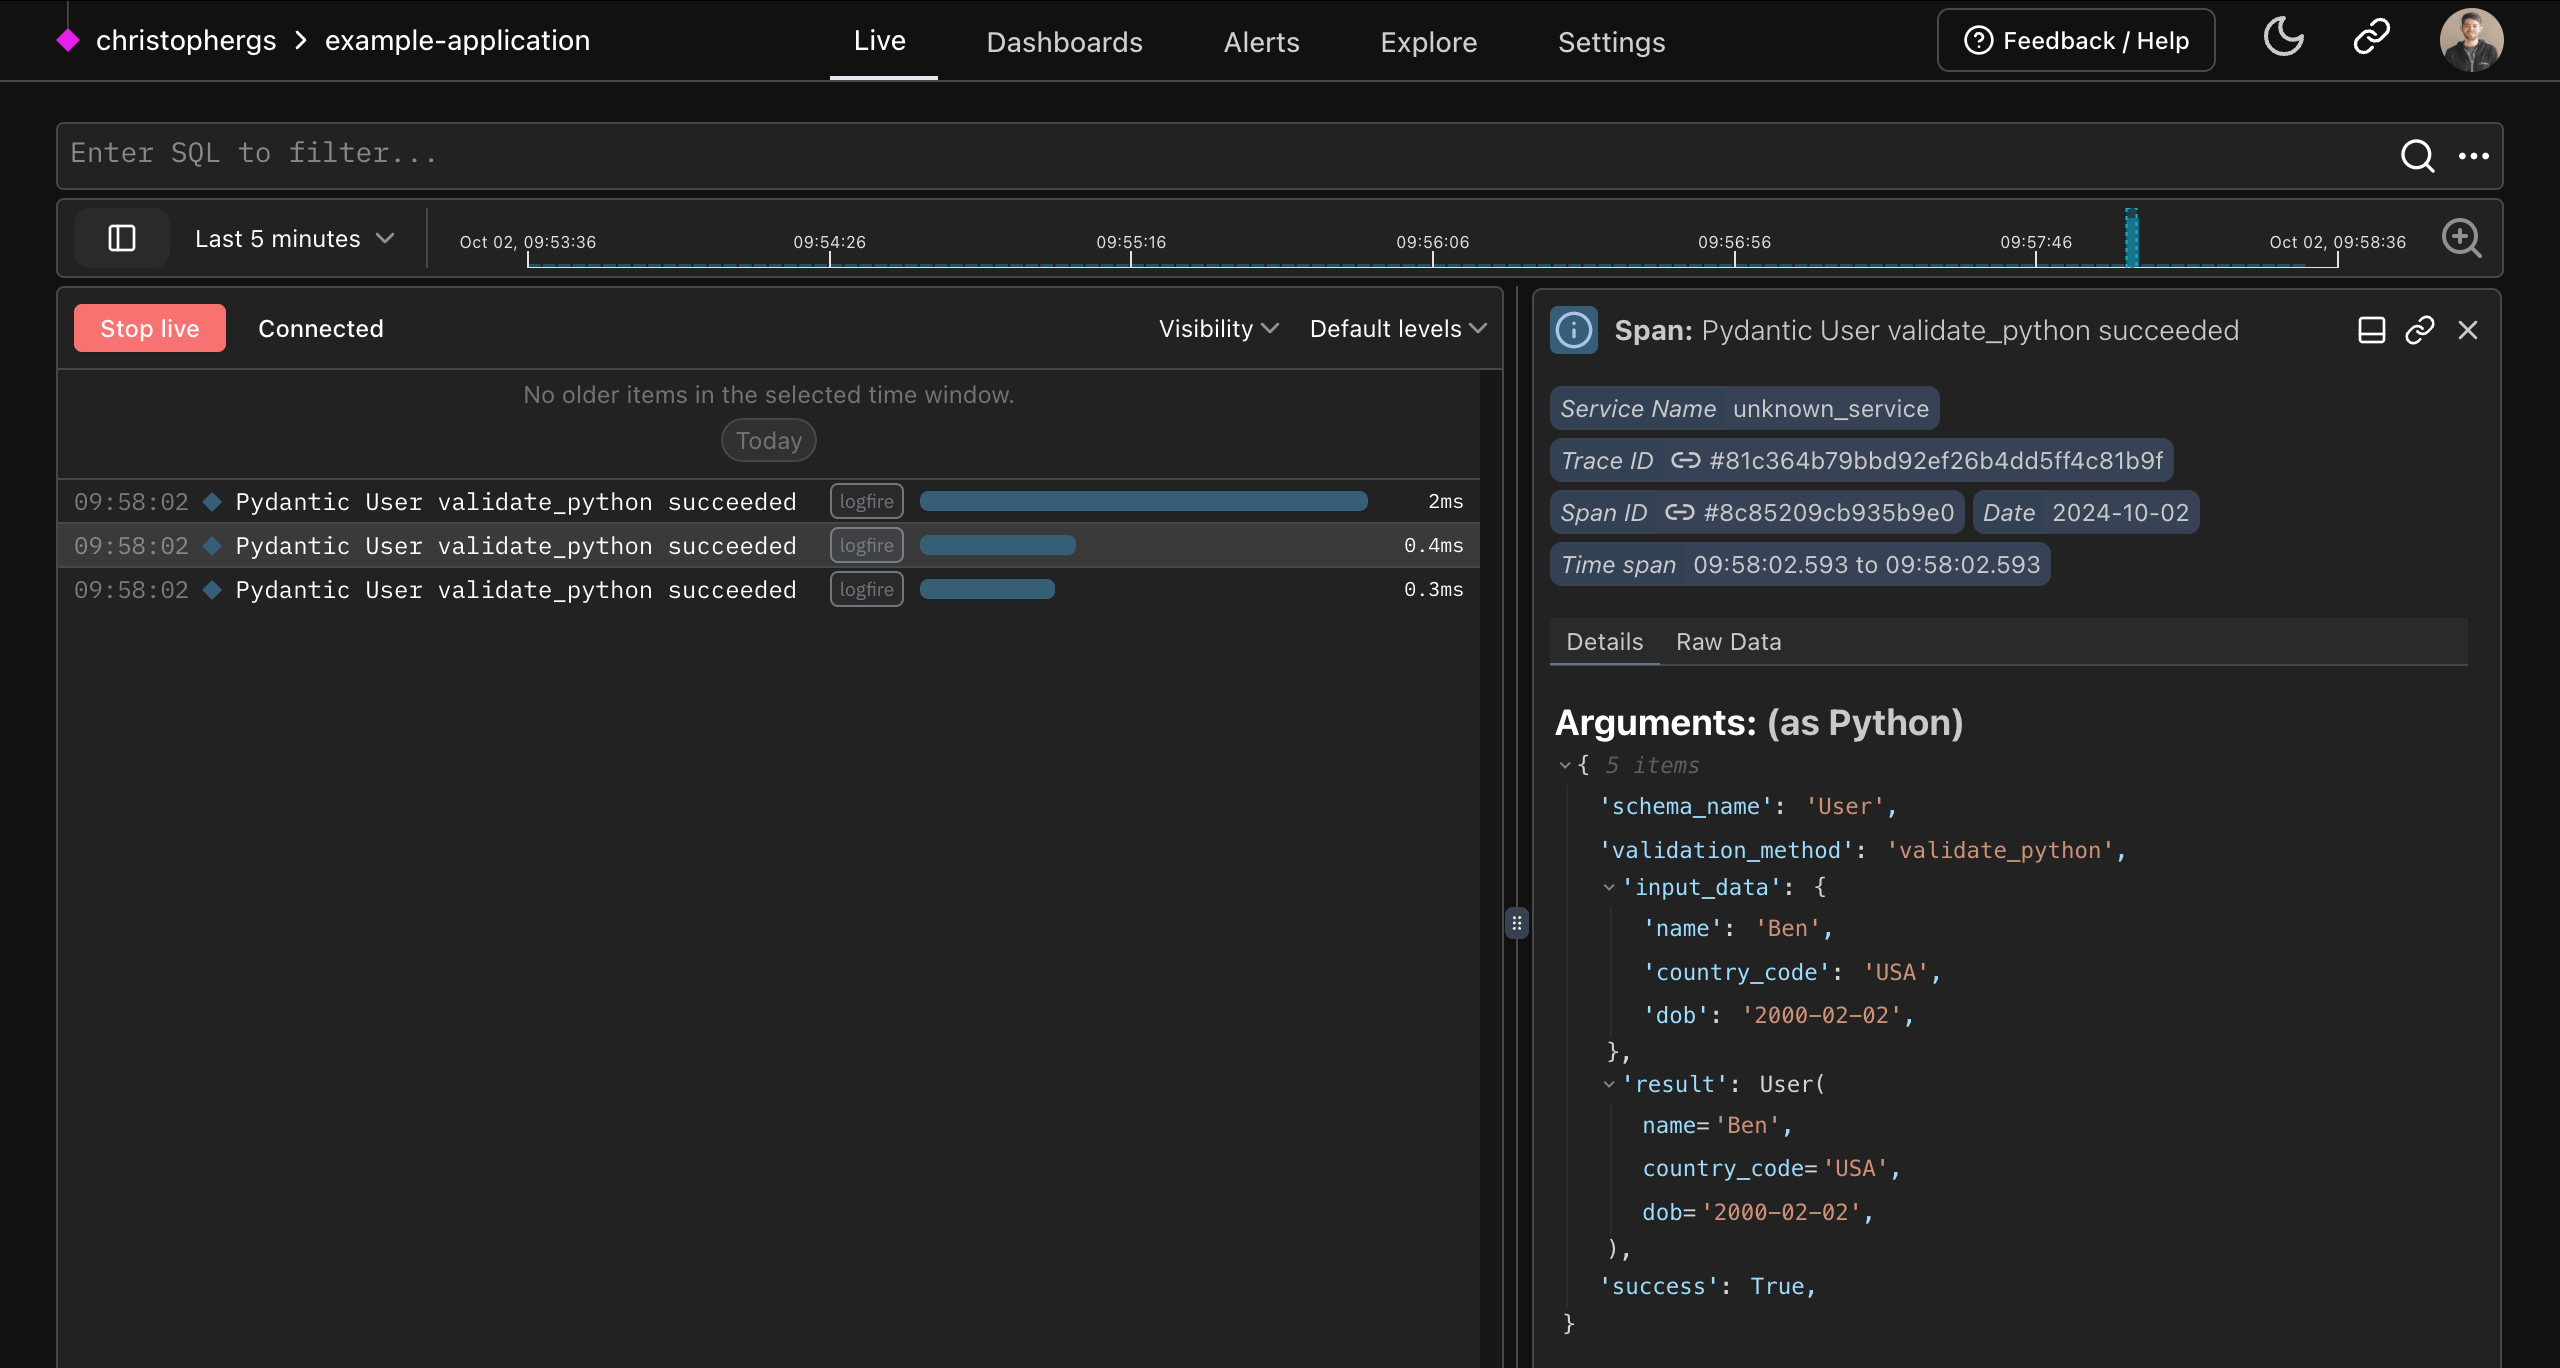
Or we can record information about validations automatically:
from datetime import date

import logfire
from pydantic import BaseModel

logfire.configure()
logfire.instrument_pydantic()  # (1)!

class User(BaseModel):
    name: str
    country_code: str
    dob: date

User(name='Anne', country_code='USA', dob='2000-01-01')  # (2)!
User(name='Ben', country_code='USA', dob='2000-02-02')
User(name='Charlie', country_code='GBR', dob='1990-03-03')
- This configuration means details about all Pydantic model validations will be recorded. You can also record details about validation failures only, or just metrics; see the pydantic plugin docs.
- Since we've enabled the Pydantic Plugin, all Pydantic validations will be recorded in Logfire.
Learn more about the Pydantic Plugin here.
OpenTelemetry under the hood 
Because Pydantic Logfire is built on OpenTelemetry, you can use a wealth of existing tooling and infrastructure, including instrumentation for many common Python packages. Logfire also supports cross-language data integration and data export to any OpenTelemetry-compatible backend or proxy.
For example, we can instrument a simple FastAPI app with just 2 lines of code:
from datetime import date

import logfire
from pydantic import BaseModel
from fastapi import FastAPI

app = FastAPI()

logfire.configure()
logfire.instrument_fastapi(app)  # (1)!
# Here you'd instrument any other library that you use. (2)


class User(BaseModel):
    name: str
    country_code: str
    dob: date


@app.post('/')
async def add_user(user: User):
    # we would store the user here
    return {'message': f'{user.name} added'}
- In addition to configuring logfire this line is all you need to instrument a FastAPI app with Logfire. The same applies to most other popular Python web frameworks.
- The integrations page has more information on how to instrument other parts of your app. Run the inspect command for package suggestions.
We'll need the FastAPI contrib package, FastAPI itself and uvicorn installed to run this:
pip install 'logfire[fastapi]' fastapi uvicorn  # (1)!
uvicorn main:app # (2)!
- Install the
logfirepackage with thefastapiextra, FastAPI, and uvicorn. - Run the FastAPI app with uvicorn.
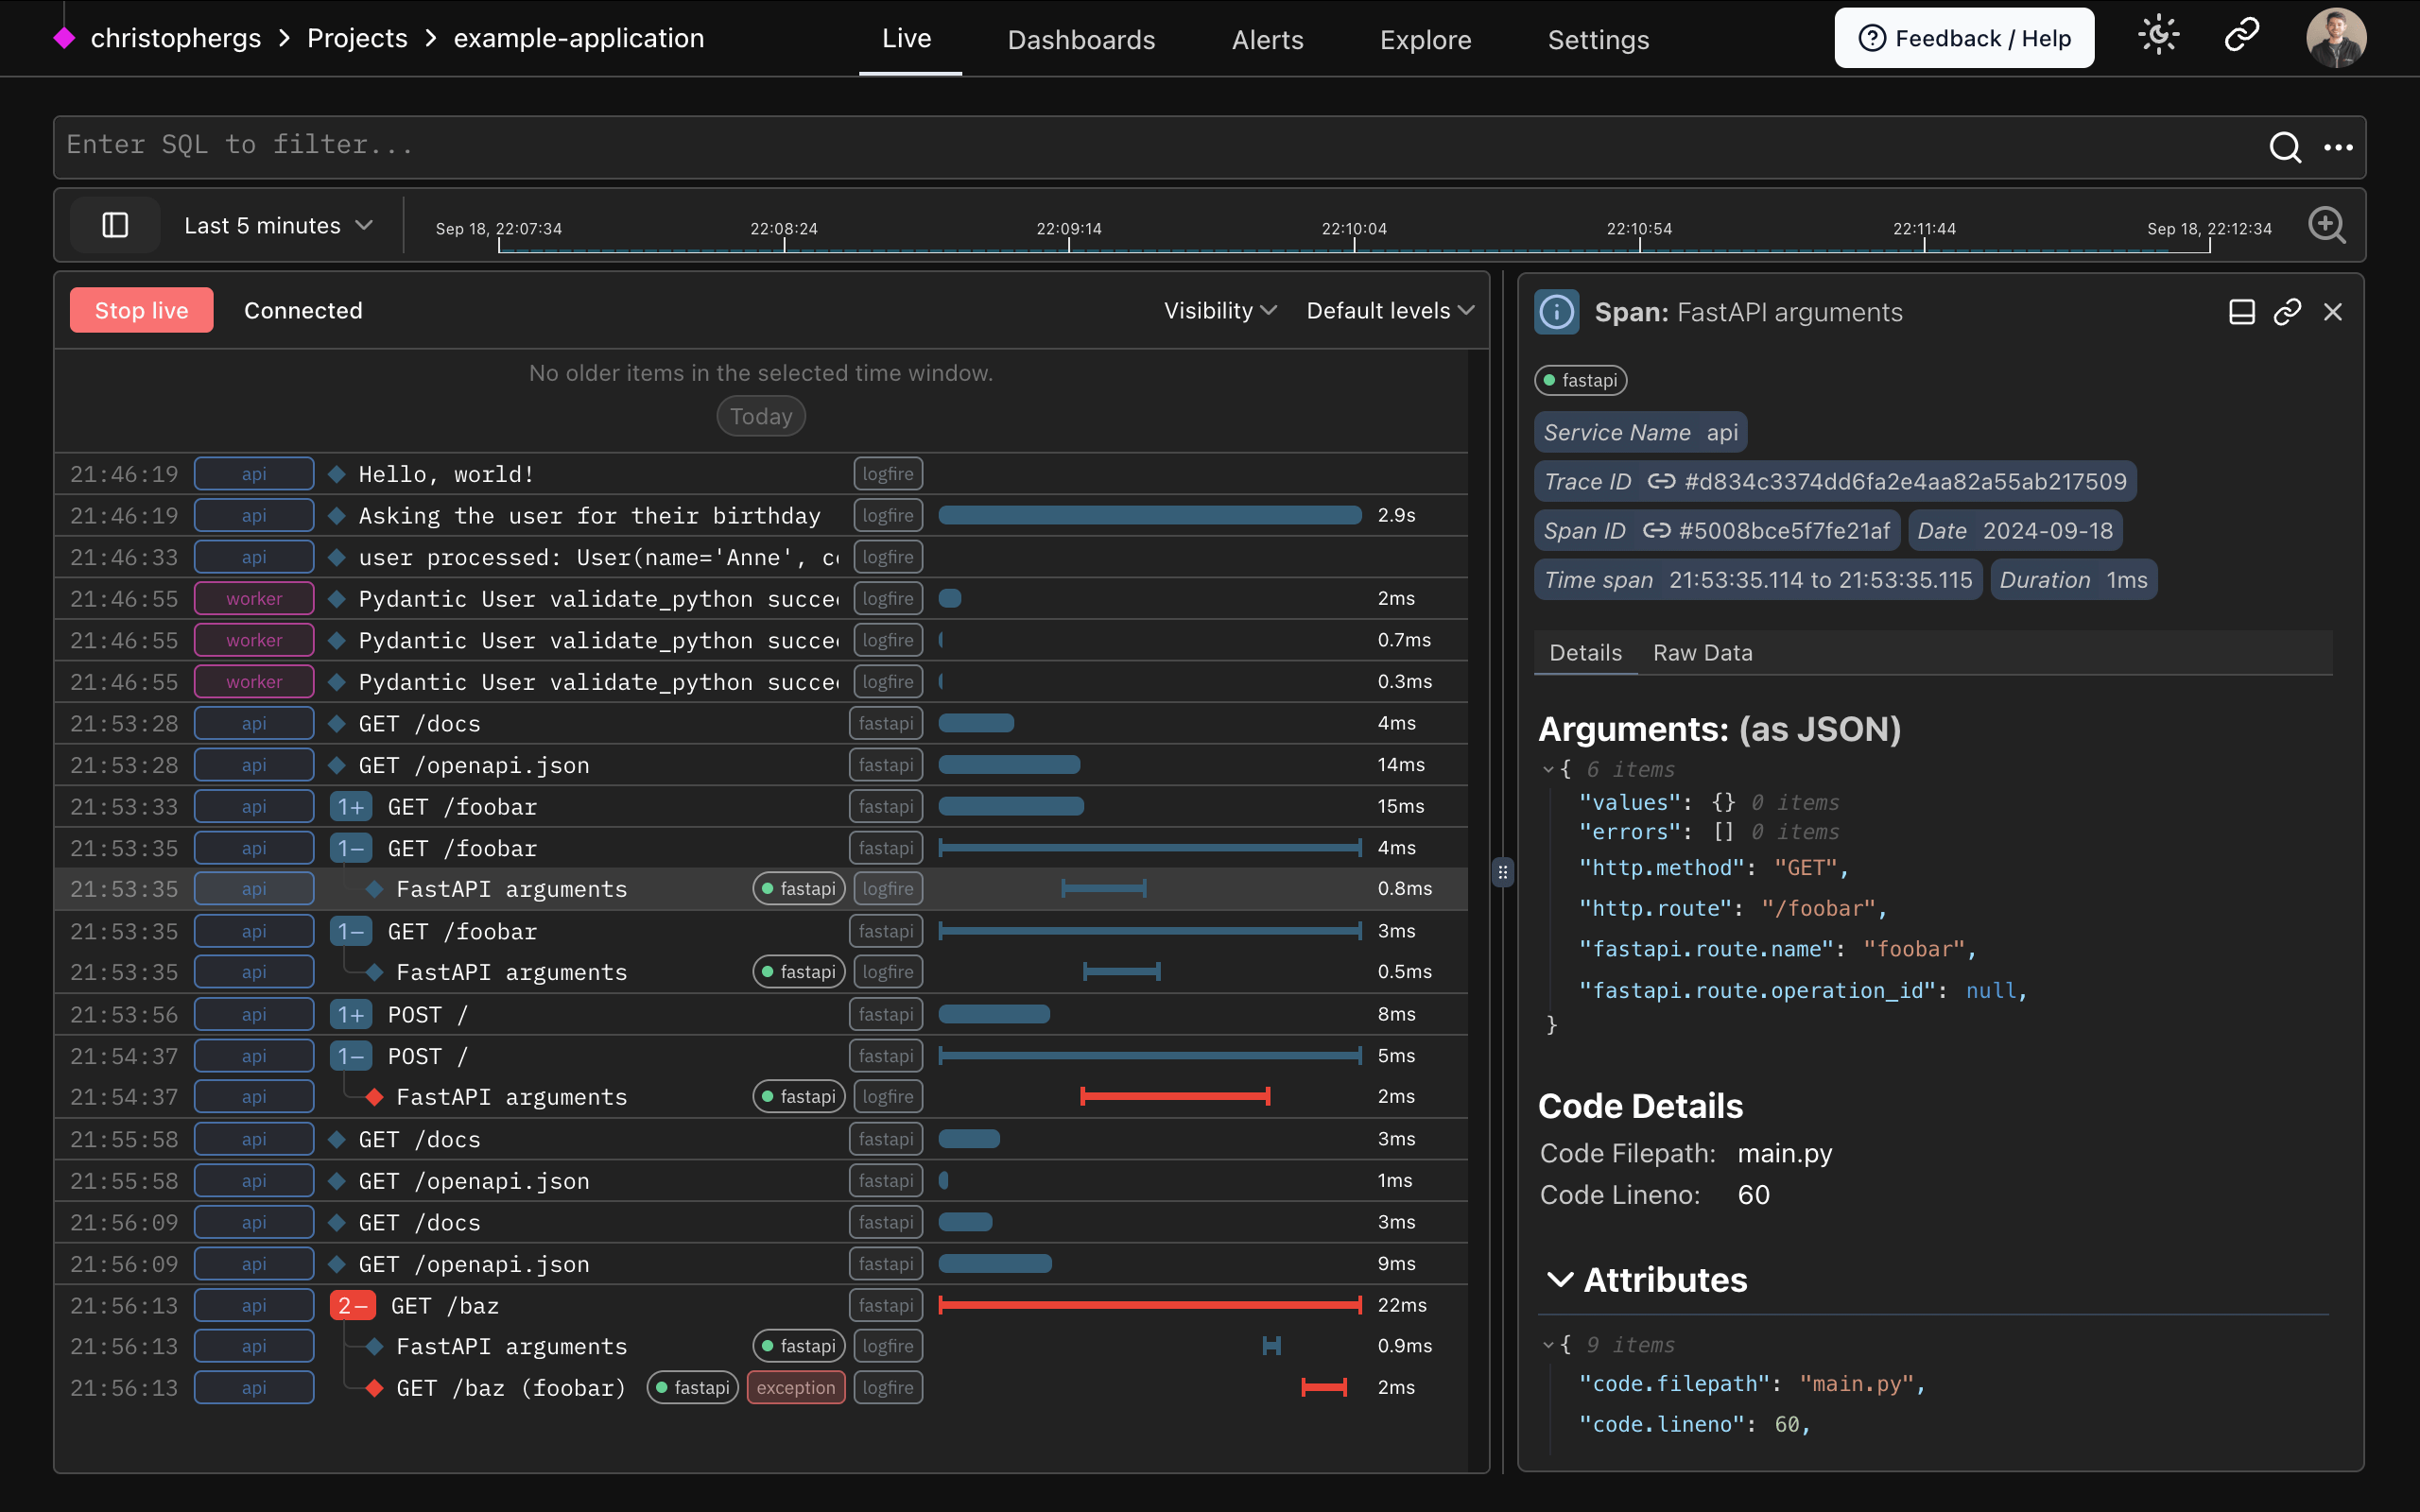
This will give you information on the HTTP request and details of results from successful input validations:
And, importantly, details of failed input validations:
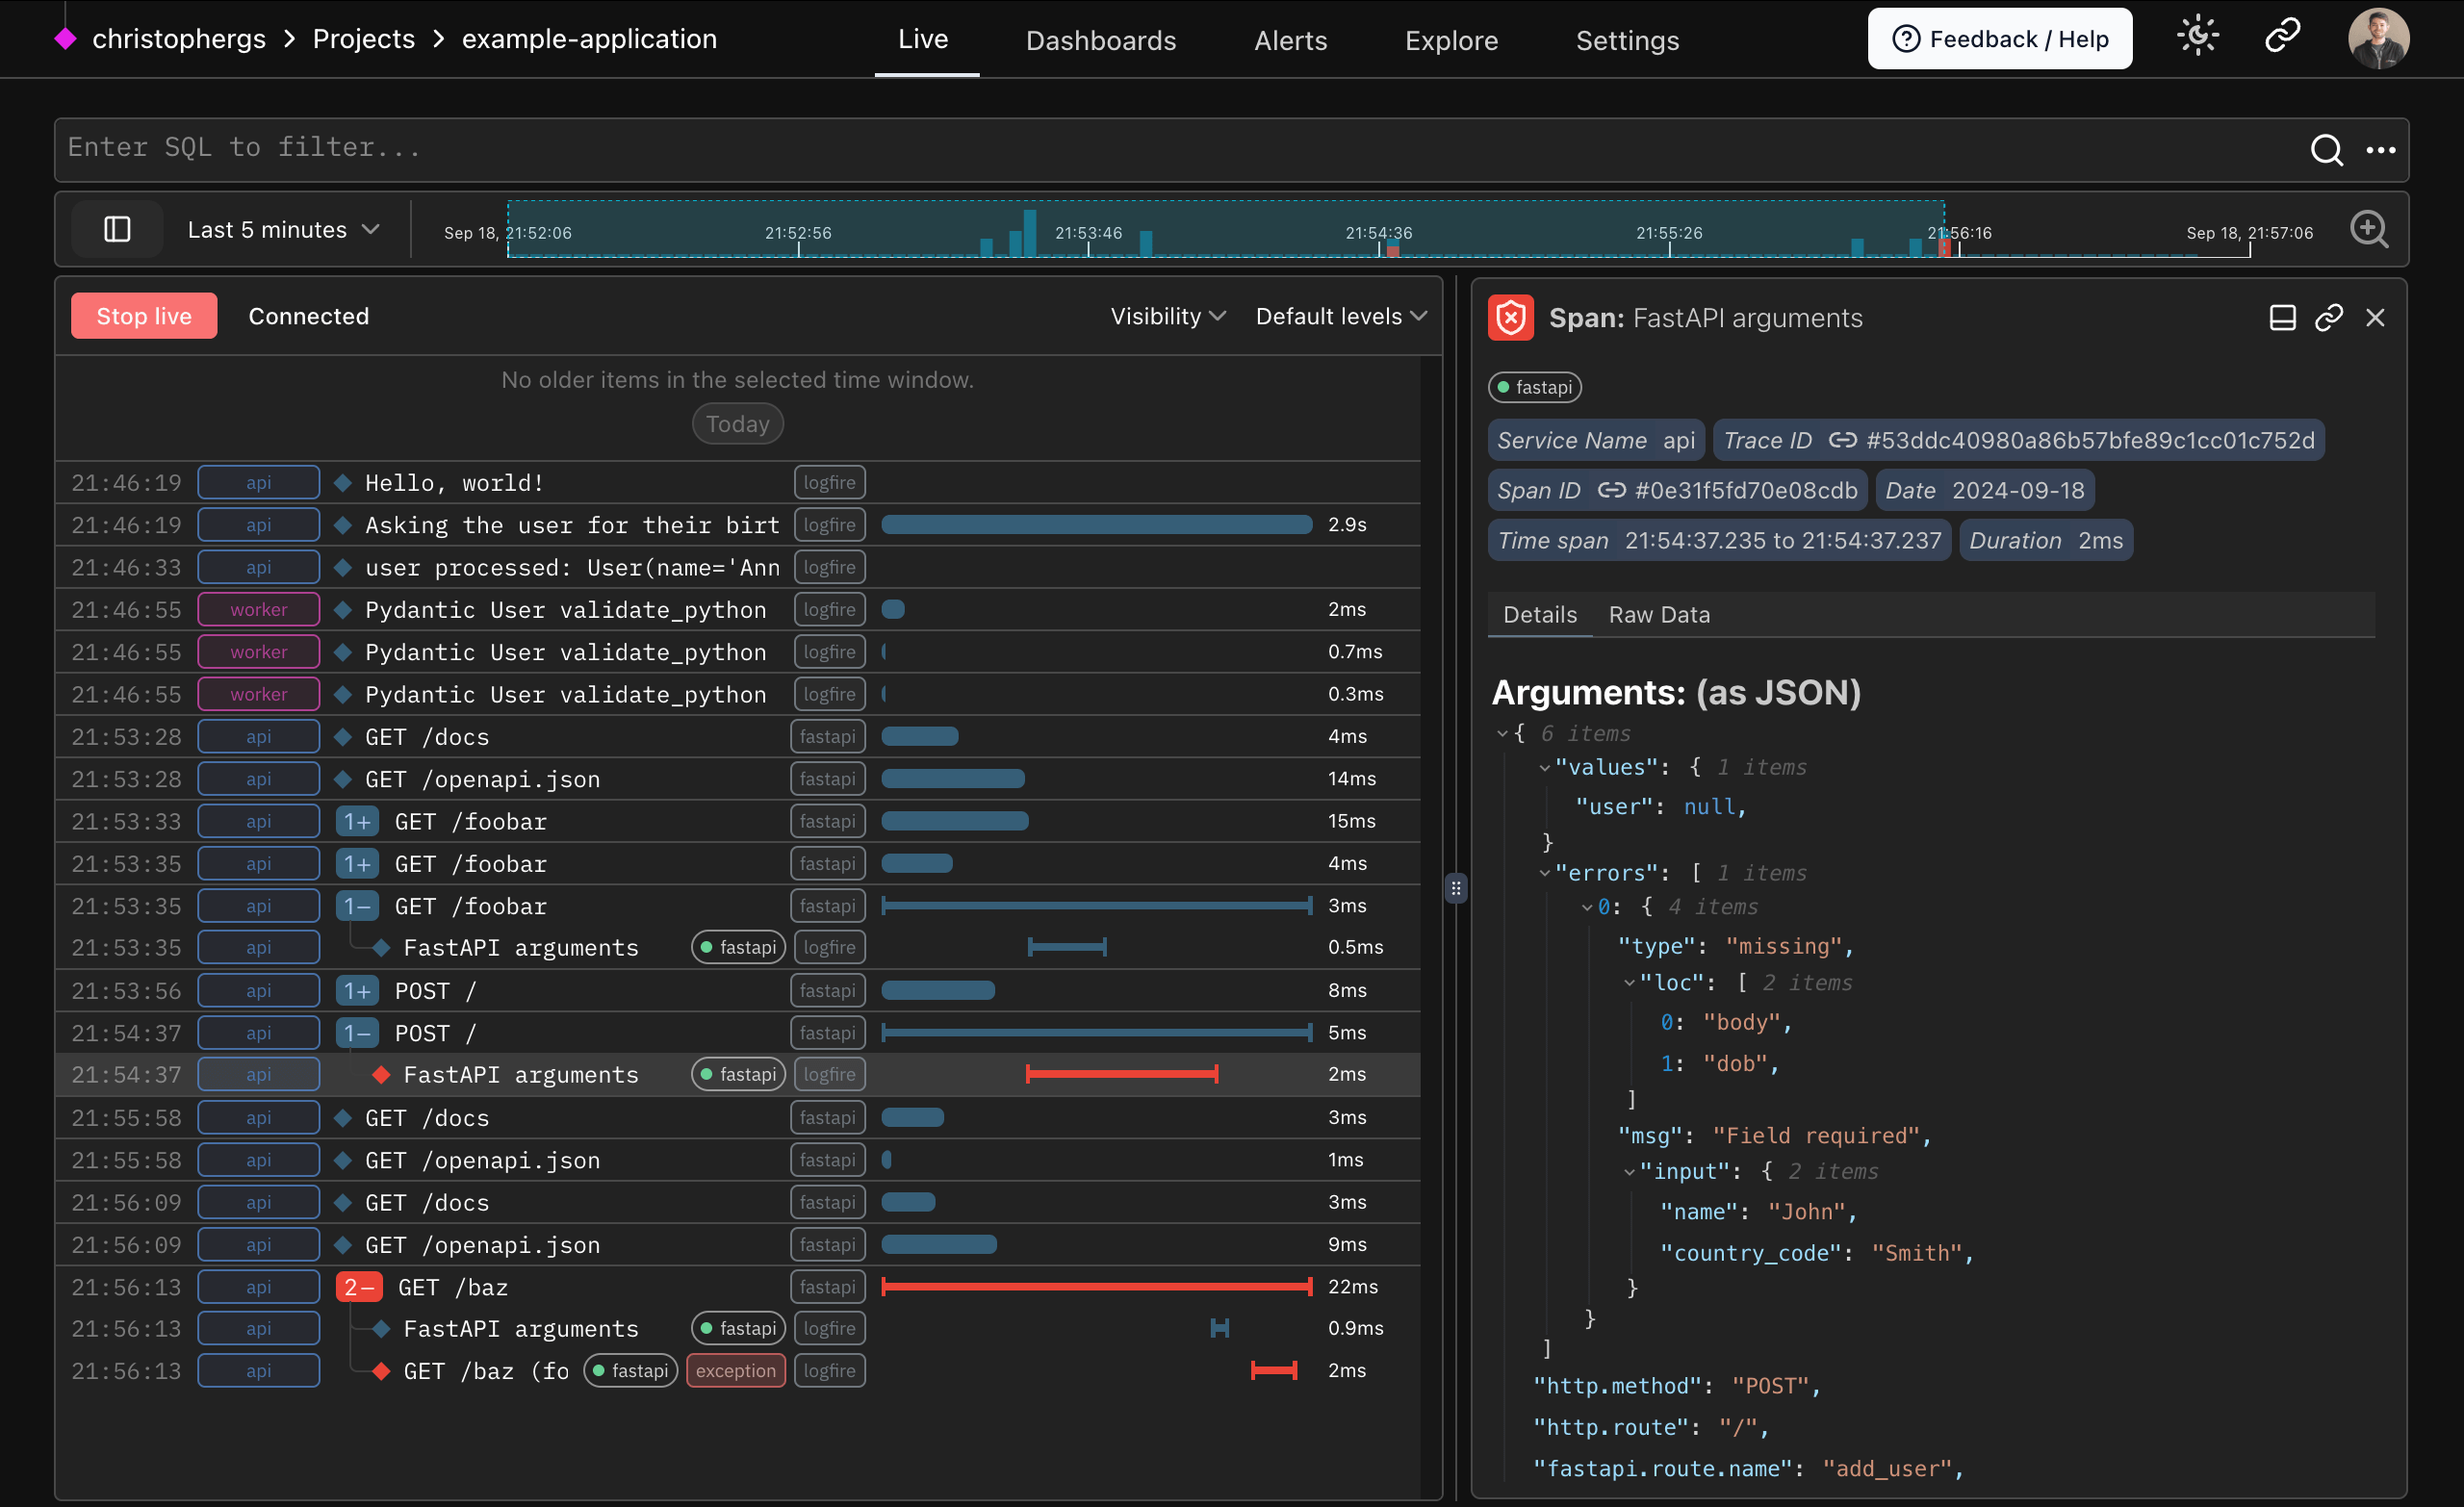
In the example above, we can see the FastAPI arguments failing (user is null when it should always be populated). This demonstrates type-checking from Pydantic used out-of-the-box in FastAPI.
Structured Data and SQL 
Query your data with pure, canonical PostgreSQL — all the control and (for many) nothing new to learn. We even provide direct access to the underlying Postgres database, which means that you can query Logfire using any Postgres-compatible tools you like.
This includes BI tools and dashboard-building platforms like
- Superset
- Grafana
- Google Looker Studio
As well as data science tools like
- Pandas
- SQLAlchemy
psql
Using vanilla PostgreSQL as the querying language throughout the platform ensures a consistent, powerful, and flexible querying experience.
Another big advantage of using the most widely used SQL databases is that generative AI tools like ChatGPT are excellent at writing SQL for you.
Just include your Python objects in Logfire calls (lists, dict, dataclasses, Pydantic models, DataFrames, and more), and it'll end up as structured data in our platform ready to be queried.
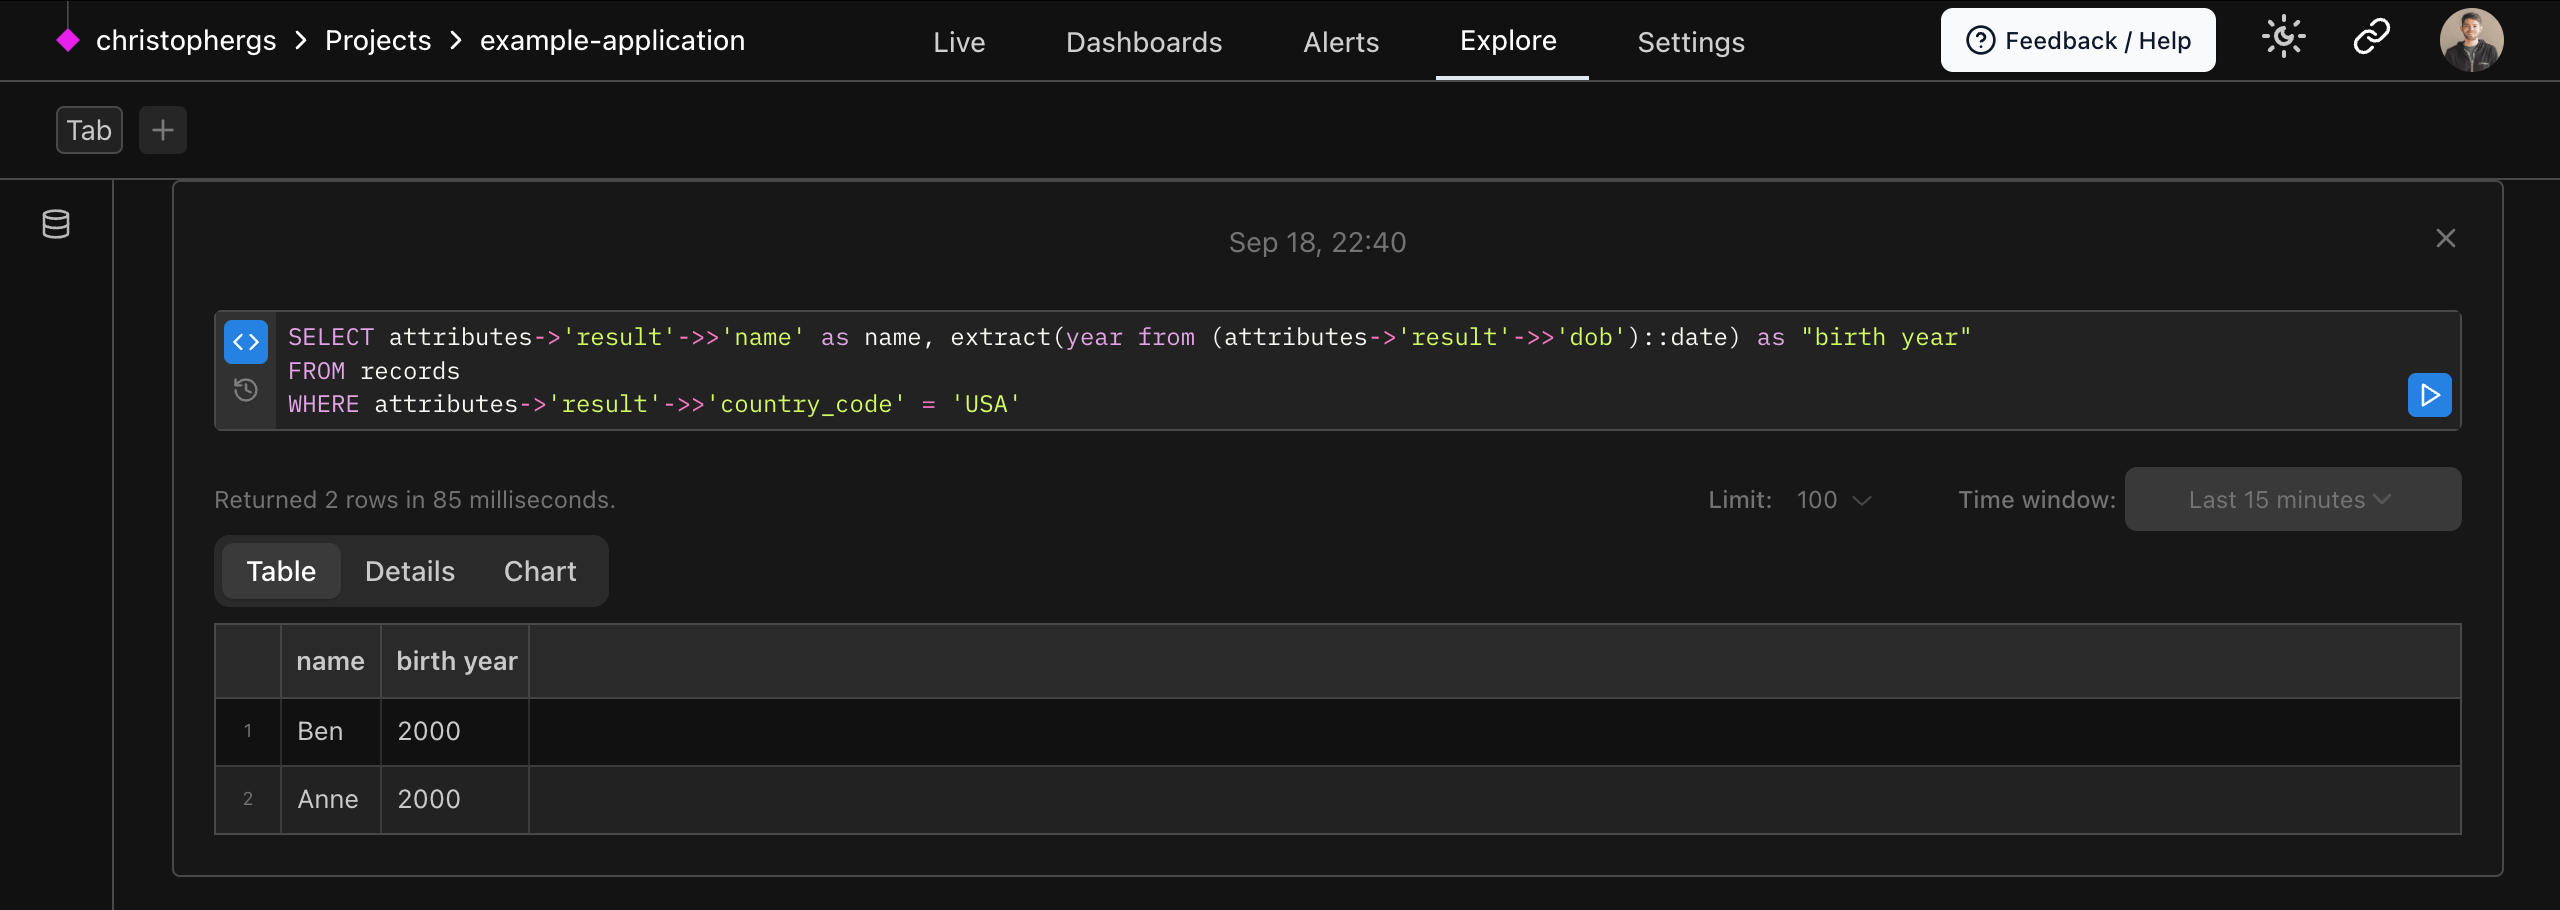
For example, using data from a User model, we could list users from the USA:
SELECT attributes->'result'->>'name' as name, extract(year from (attributes->'result'->>'dob')::date) as "birth year"
FROM records
WHERE attributes->'result'->>'country_code' = 'USA';
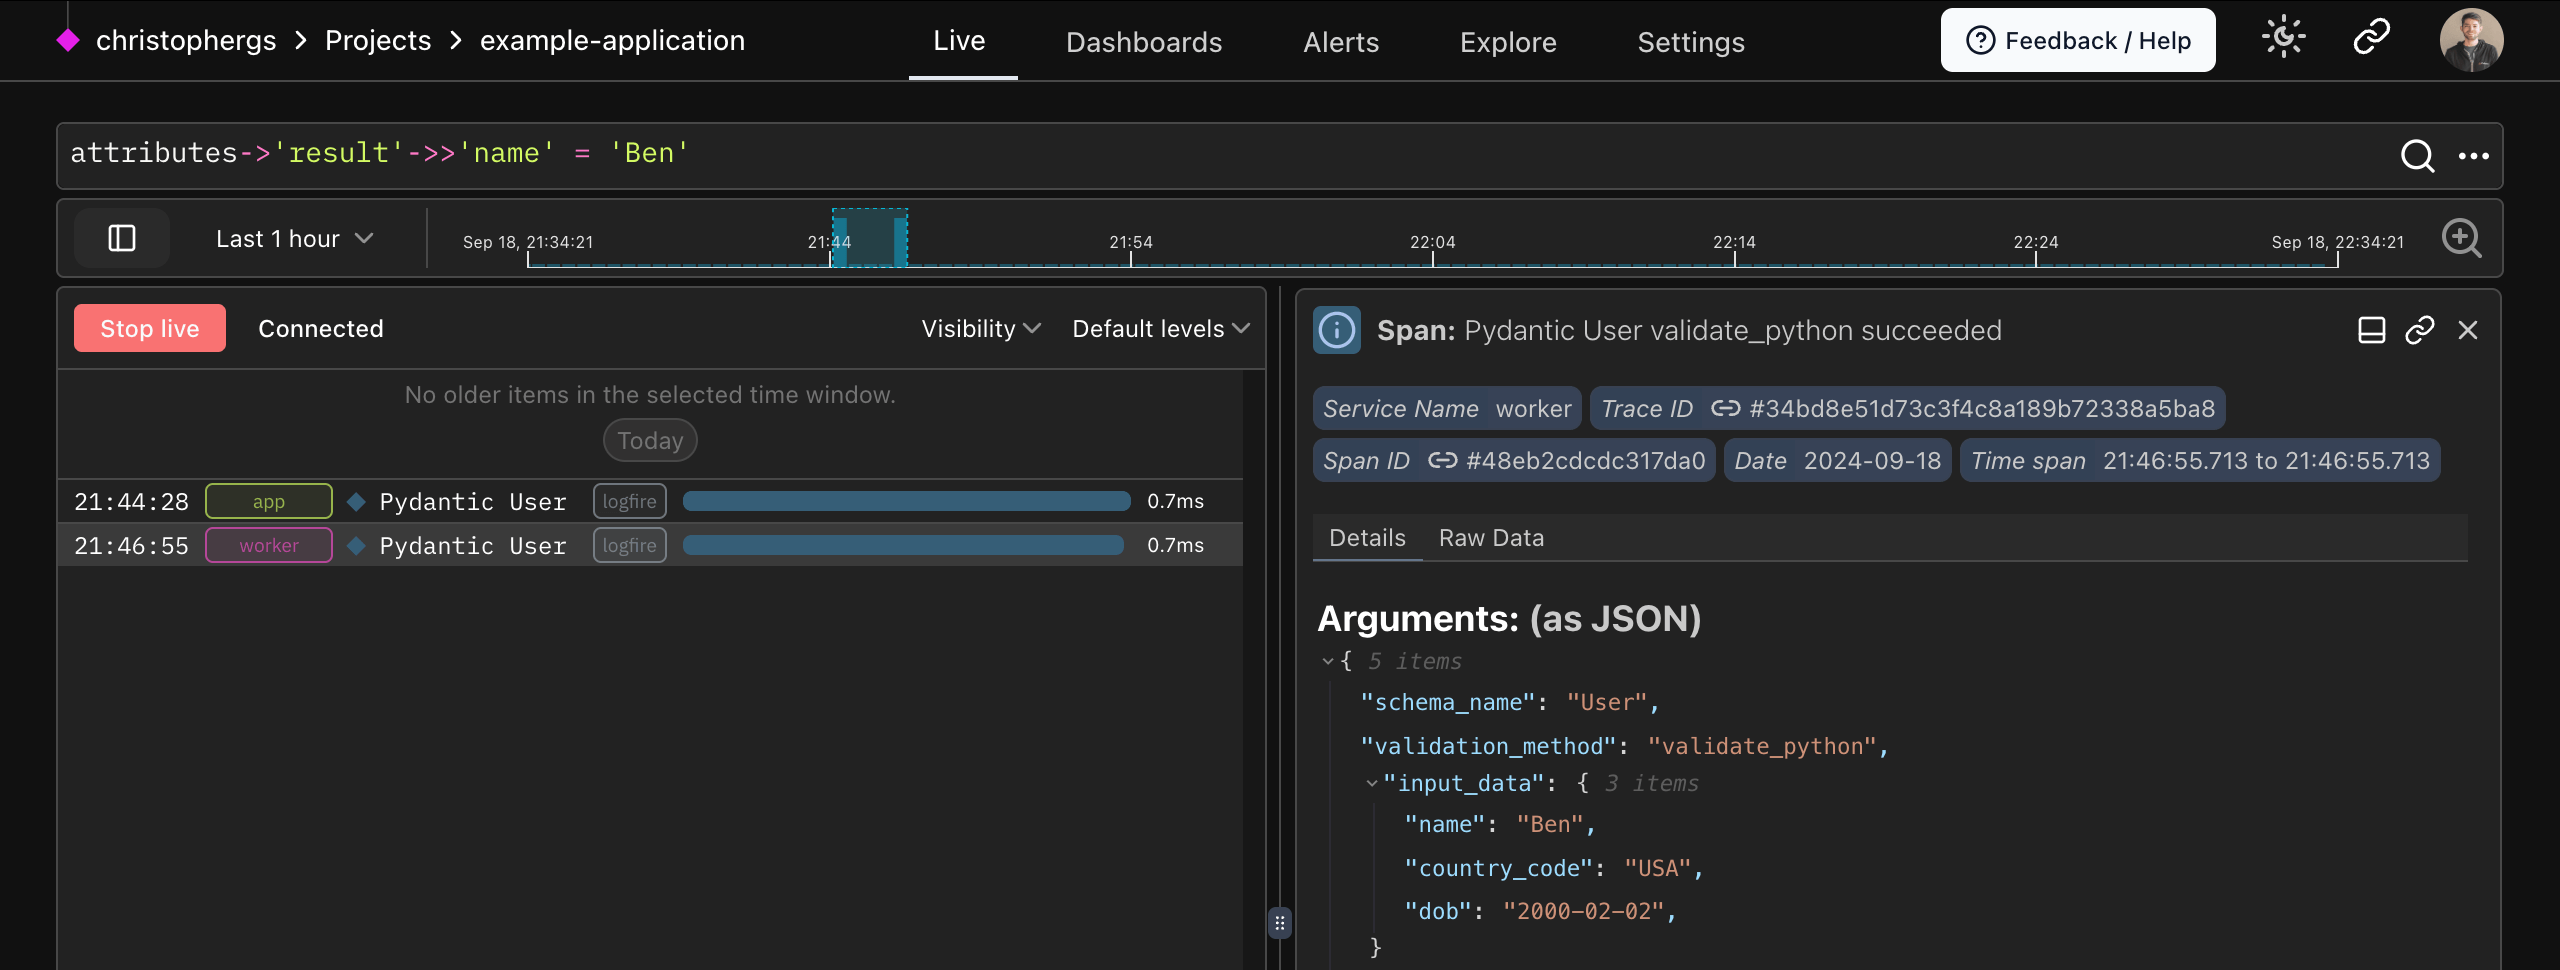
You can also filter to show only traces related to users in the USA in the live view with
attributes->'result'->>'name' = 'Ben'
Structured Data and Direct SQL Access means you can use familiar tools like Pandas, SQLAlchemy, or psql
for querying, can integrate seamlessly with BI tools, and can even leverage AI for SQL generation, ensuring your Python
objects and structured data are query-ready.